by Neil Breach, H&S Sub-committee Chair BDA
May 25, 2023
Within the membership renewal pack, we asked for companies to send us their accident and incident statistics. About half of all companies returned the completed form, which represents the largest and most accurate data set collected by the BDA for over a decade. A huge thank you to all those who returned the form and a gentle request / reminder to everyone else – it’s not too late to send us your statistics!
So, what does the BDA do with your data?
Collecting accident statistics is an essential practice that offers numerous benefits to individuals, organisations, and society. These statistics provide valuable insights into the causes, consequences, and patterns of accidents, allowing us to make informed decisions and take proactive measures to prevent future incidents. By analysing accident data, we can identify risk factors, design effective safety measures, and promote a culture of safety. The key benefits of collecting accident statistics are:
Accurate risk assessment: Accident statistics enable us to assess the likelihood and severity of accidents in different contexts. By analysing historical data, we can identify high-risk areas, activities, or industries, allowing us to prioritize resources and implement targeted preventive measures. This information is particularly valuable for managers, safety professionals, and organizations to allocate resources effectively and mitigate potential risks.
Improved safety measures: Accident statistics provide crucial information about the causes and contributing factors of accidents. By looking at these statistics the BDA can provide focused advice and training and sharing the outcomes empowers Members to develop and implement more effective safety protocols, standards, and technologies. As a result, we can reduce the occurrence and severity of accidents, making workplaces, public spaces, and transportation systems safer for everyone.
Economic benefits: Accidents can have significant economic consequences, including medical costs, property damage, legal fees, and productivity losses. By collecting accident statistics, organizations can quantify these costs and evaluate the economic impact of accidents. This information helps in justifying investments in safety measures and implementing cost-effective prevention strategies. Furthermore, by reducing accidents, businesses can experience fewer disruptions, lower insurance premiums, and improved employee morale and retention.
Behavioural insights: Analysing accident data can reveal patterns and trends in human behaviour that contribute to accidents. These insights are particularly valuable in shaping educational campaigns, training programs, BDA Audit, and awareness initiatives. By understanding the factors that lead to accidents, we can develop targeted interventions to modify behaviour and promote safer practices.
Legal and regulatory improvements: Accident statistics play a crucial role in the development of laws, regulations, and standards aimed at improving safety. Policymakers rely on this data to evaluate the effectiveness of existing regulations and identify gaps or areas that require further attention. Accurate and comprehensive accident statistics contribute to evidence-based policymaking and facilitate the implementation of laws that protect individuals and promote public safety.
Monitoring progress: Collecting accident statistics allows us to monitor the effectiveness of safety initiatives and interventions over time. By comparing current data with historical records, we can assess the impact of specific measures and identify areas where further improvements are necessary. This feedback loop ensures that our efforts to prevent accidents are evidence-based and adaptable, leading to continuous improvement in safety practices.
We’ll be providing further analysis of the data to provide an Accident Frequency Rate to compare our sector with UK construction and see how drilling fairs and where the statistic show there is a cause for concern.
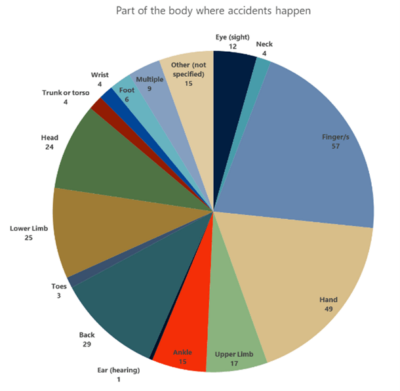
NB. The diagrams below are not readable they are provided to demonstrate the scope of data requested.
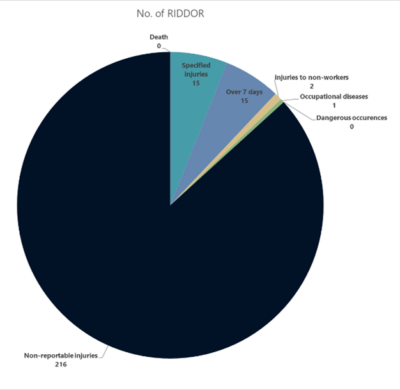
For 2022, the top three headline industry injury causes for were:
For 2022, the top three areas of the body injured were:
Also of significance was members reported mental health affecting 18 members of staff which caused a cumulative 426 days of absence. Long recognising this as an often hidden ‘injury’ the BDA is championing the issues of mental health and wellbeing and has several Initiatives in place to help both address and raise awareness.
The BDA will be highlighting key areas and specific data over the coming months offering advice and guidance on how to reduce risk and the number of incidents.
Sign up to our newsletter to keep updated on our latest news.