
The 2025 dataset shows improving reporting maturity and a significant reduction in RIDDOR outcomes, but also confirms that the same core accident mechanisms remain stubbornly present across the drilling sector.
August 3, 2026
The British Drilling Association (BDA) remains committed to improving health and safety performance across the drilling sector through evidence-based analysis, transparent reporting and collaborative industry engagement. The annual accident statistics report provides an important opportunity to review not only the number and type of accidents occurring across member organisations, but also the underlying patterns that continue to shape the sector’s risk profile.
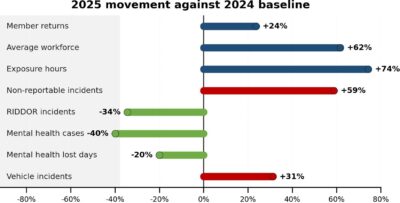
The 2025 dataset represents a more robust evidence base than previous years, with member participation increasing from 72% in 2024 to 90% in 2025. This improvement is significant because accident statistics are only meaningful when they are sufficiently representative of the industry being assessed. Increased participation gives the BDA greater confidence in the trends identified and allows the sector to move beyond headline incident numbers towards a more meaningful discussion about causation, exposure and long-term prevention.
The reported workforce increased from 5,287 in 2024 to 8,548 in 2025, while exposure hours increased from approximately 10.43 million to 18.18 million. These changes mean that year-on-year comparisons must be interpreted carefully, particularly where increased reporting maturity may have increased the visibility of lower-severity incidents.
HSE statistics continue to demonstrate why accident performance must be considered within the broader context of occupational health, safety and fatal risk. Across Great Britain, 126 workers were killed in work-related accidents during 2025/26, equating to a fatal injury rate of 0.37 deaths per 100,000 workers. While this represents a reduction of two fatalities from the previous year and, excluding the years affected by the COVID-19 pandemic, is provisionally the lowest annual total recorded, HSE notes that fatal injuries remain subject to year-on-year variation and should be interpreted over longer periods to identify meaningful trends. Encouragingly, the long-term trend continues to show a decline in fatal injury rates, although the pace of improvement has slowed in recent years.
Construction remains one of the highest-risk sectors in Great Britain and continues to account for the largest share of worker fatalities. During 2025/26, 25 construction workers lost their lives in work-related accidents, compared with a five-year annual average of 37 fatalities. Although this reduction is positive, construction still accounted for the highest number of worker deaths of any major industry sector. When measured by fatal injury rate, construction recorded 1.23 fatalities per 100,000 workers in 2025/26 and a five-year average rate of 1.78 per 100,000 workers, approximately five times higher than the all-industry average.
The latest HSE fatality data also highlights the continuing significance of a small number of recurring accident mechanisms. Falls from height remain the leading cause of workplace fatality, accounting for 31 worker deaths during 2025/26 and averaging 37 fatalities per year over the last five years. Together, falls from height, being struck by a moving object and being struck by a moving vehicle account for around 60% of all worker fatalities nationally. Within construction specifically, more than half of all worker deaths over the five-year period were attributable to falls from height, underlining the ongoing importance of effective work-at-height planning, supervision and control measures.
The HSE statistics also identify demographic trends that warrant attention. Workers aged 60 and over accounted for 32% of all worker fatalities despite representing only around 12% of the workforce, while approximately one-third of all fatal injuries involved self-employed workers, who continue to experience fatal injury rates significantly higher than employees. These findings reinforce the importance of considering workforce demographics, competence, supervision and the management of higher-risk activities when developing future industry safety improvement strategies.
The non-fatal construction profile also provides an important comparator for BDA. HSE estimates that 50,000 construction workers sustained non-fatal workplace injuries over the 2022/23 to 2024/25 average period, with 29% resulting in over seven days absence. Construction had a self-reported non-fatal injury rate of around 2.5%, which was statistically significantly higher than the all-industry rate of 1.8%. RIDDOR data provides further detail, with 3,726 non-fatal employee injuries in construction in 2024/25, of which 1,525 were specified injuries and 2,201 were over-seven-day injuries.
The construction ill-health data is particularly relevant to the BDA because it shows a strong musculoskeletal burden. HSE estimated 79,000 construction workers suffering from work-related ill health, of which 53% were musculoskeletal disorders. Construction had an estimated 41,000 workers suffering from work-related musculoskeletal disorders and a rate of around 2.0%, which was statistically significantly higher than the all-industry rate of 1.2%. This supports the BDA finding that handling, posture, repetitive movement and physical work design remain key improvement themes.
HSE also reported that construction had an estimated 15,000 workers suffering from work-related stress, depression or anxiety, representing 19% of construction ill health, while the construction rate of 0.7% was statistically significantly lower than the all-industry rate of 2.0%. This does not mean mental health is not relevant to drilling; rather, it suggests that BDA should interpret its member-reported mental health absence cautiously, strengthen consistency of reporting and treat wellbeing as part of operational resilience rather than as a separate initiative.
Construction respiratory risk also remains material. HSE reported an estimated 5,000 construction workers suffering from work-related breathing or lung problems, with a construction rate of 0.23% that was statistically significantly higher than the all-industry rate of 0.11%. This is relevant to drilling because dust, silica, exhaust emissions, ground conditions and historic construction exposures remain important long-term health considerations.
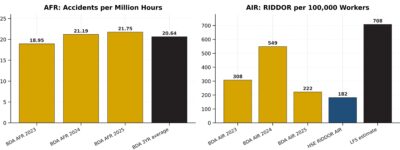
The most encouraging movement in the 2025 statistics is the reduction in RIDDOR-reportable incidents. RIDDOR incidents fell from 29 in 2024 to 19 in 2025, representing a 34% reduction. On a rate basis this improvement is even more meaningful, with the BDA Accident Incident Rate (AIR) reducing from 549 to 222 per 100,000 workers. This represents a 60% reduction and brings the sector closer to the HSE RIDDOR-based construction benchmark, while remaining significantly below the wider Labour Force Survey estimate for construction injury.
However, the Accident Frequency Rate (AFR) presents a more cautious picture. The BDA AFR moved only marginally, from 21.19 in 2024 to 21.75 in 2025, remaining close to the three-year BDA average of approximately 20.64. This distinction between AIR and AFR is important. At face value, the figures suggests a substantial improvement in reportable injury performance across the sector. However, this improvement should be interpreted within the context of a significant increase in reporting participation, which rose from 72% of members in 2024 to 89% in 2025, together with a corresponding increase in reported workforce numbers and exposure hours. The broader dataset provides a more representative picture of industry performance and may have increased the reporting of lower-severity incidents and near misses. Whilst the reduction in AIR indicates fewer reportable injuries per 100,000 workers.
The relatively stable AFR suggests that the underlying frequency of accidents has not reduced to the same extent. This may indicate that the sector has been more successful in reducing the severity and consequences of incidents than in eliminating the underlying hazards themselves.
For reporting purposes the calculation of Accident Incident Rates (AIR) & Accident Frequency Rates (AFR) are determined as follows:
This is a positive but nuanced picture. It would be reasonable to conclude that the sector has made progress in reducing more serious outcomes, but it would be premature to conclude that the underlying hazards have been fully controlled. Where accident frequency remains broadly stable, there remains the potential for lower-severity events to escalate under different circumstances.
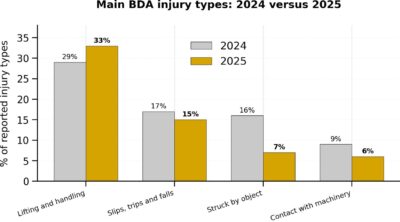
Manual handling remains the dominant injury mechanism within the BDA dataset. In 2025, lifting and handling accounted for approximately 33% of the main reported injury profile, increasing from 29% in 2024. This is the clearest negative trend in the causation data and confirms that manual handling remains deeply embedded in drilling activity.
Slips, trips and falls reduced from 17% to 15%, contact with machinery reduced from 9% to 6%, and struck-by-object incidents reduced from 16% to 7% based on the HSE classification. These reductions are positive, but the continued prominence of the same accident types indicates that the core risk profile of drilling has not fundamentally changed.
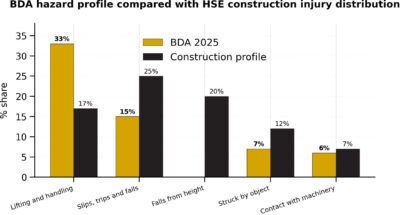
Construction data provides a useful but imperfect comparator. HSE construction injury data shows slips, trips and falls as the largest non-fatal accident kind at 25%, followed by falls from height at 20%, injured while handling, lifting or carrying at 17%, and struck by moving or flying/falling object at 12%. The BDA profile differs because lifting and handling is proportionally higher, while fall-from-height injury is less prominent in the BDA 2025 return. This suggests that BDA safety improvement should remain focused on the drilling-specific interface between people, tools, plant, ground conditions, and manual work design.
The RIDDOR profile provides further insight. In 2025, contact with machinery and lifting and handling each accounted for six RIDDOR cases. Slips, trips and falls accounted for three RIDDOR cases, while contact with electricity, struck-by-object and struck-against incidents accounted for the remaining reportable cases.
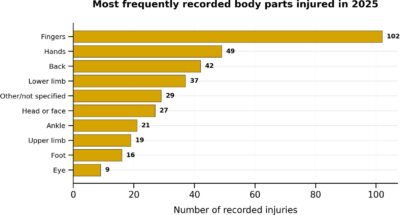
Body-part data reinforces this conclusion. Finger injuries were the most frequently recorded body-part category in 2025, followed by hand, back, and lower-limb injuries. This pattern aligns closely with the leading accident types and suggests that the most common injuries are often associated with direct physical interaction with drilling equipment, tooling, materials, working platforms, uneven ground and moving parts.
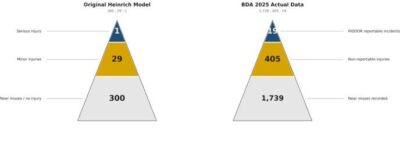
The 2025 BDA incident triangle provides a useful additional perspective. The dataset records 1,739 near misses, 405 non-reportable injuries, 19 RIDDOR reportable incidents and no fatalities. The original Heinrich model is commonly expressed as 300 near misses, 29 minor injuries and one serious injury. It is important not to scale the model as if it were a predictive rule; it is better used as a visual comparator for reporting maturity and the relationship between lower-severity events and more serious outcomes.
When the BDA data is normalised against one RIDDOR event, the BDA ratio is approximately 92 near misses and 21 non-reportable injuries for every one RIDDOR event. Compared with Heinrich’s 300:29:1 relationship, this suggests either that the BDA profile differs from the historical model, or that near miss reporting is still not capturing the full volume of learning opportunities across the sector. This should not be interpreted as a weakness in isolation. Instead, it should prompt a more mature discussion about the quality, classification and learning value of near miss reporting.
Perhaps the most significant finding from the 2025 dataset is not what has changed, but what has remained consistent. Despite improvements in training, auditing, equipment standards, supervision and reporting culture, the drilling industry continues to experience broadly the same accident types year after year. Manual handling remains the leading cause of injury, while slips, trips and falls, contact with machinery and struck-by-object incidents continue to account for a substantial proportion of recorded accidents.
This persistence prompts the question. If the industry has spent many years improving procedures, competence, site controls and safety management systems, why are the same injury mechanisms still occurring?
One explanation is that many of these hazards are intrinsically linked to the nature of drilling operations. Unlike some areas of construction that have been able to industrialise, automate or standardise large elements of their work, drilling remains heavily dependent on the movement, positioning, connection, disconnection and maintenance of physical equipment. Rods, casings, tooling, samples, hoses, drilling fluids and ancillary equipment must often be handled and controlled in live site environments.
In that sense, some of the risk profile can reasonably be regarded as occupational. Drilling is physical work and, even where modern equipment is used, there remains a degree of interaction between people, plant, equipment and the ground. However, accepting that certain hazards are intrinsic to drilling must not lead to the conclusion that the resulting injuries are inevitable. That distinction is critical.
The continued recurrence of similar accident types suggests that the industry may still be relying too heavily on administrative and behavioural controls. Toolbox talks, training, procedures, risk assessments, pre-start briefings and supervision all remain essential. They are necessary parts of a mature safety management system. However, they sit relatively low within the hierarchy of controls when compared with elimination, substitution and engineering controls.
The 2025 statistics suggest that the next stage of safety improvement may depend on how effectively the drilling sector applies prevention through design. The industry already understands its principal accident mechanisms. The recurring nature of the data indicates that the challenge is no longer simply identifying the hazards, but eliminating or reducing exposure to them before work starts.
Historically, safety improvement has often focused on the worker and the worksite. This has included training operatives, improving supervision, strengthening method statements, completing audits and issuing safety alerts. These measures remain important, but they do not always alter the fundamental design of the task. In many cases they ask workers to manage hazardous activities more carefully rather than removing the hazardous interaction altogether.
A more mature approach requires the industry to ask different questions at the planning and design stage. Can the handling activity be eliminated? Can equipment be delivered closer to the point of use? Can tooling be redesigned to reduce weight or improve handling points? Can lifting aids be provided as standard rather than as an exception? Can rod handling be automated or mechanically assisted? Can the site set-up reduce carrying distances, improve access routes and separate pedestrians from vehicles and plant? Can hand exposure be removed from pinch points through guarding, tooling modification or changed working methods?
The phrase occupational hazard can be useful when describing the inherent risk profile of a sector, but it can also become problematic if it leads to passive acceptance. Manual handling, hand injuries and slips, trips and falls may be common in drilling, but common does not mean unavoidable. The data suggests that these are occupationally associated hazards, not necessarily occupationally acceptable outcomes.
A more constructive interpretation is that drilling has a known and predictable risk profile. Because the risks are known and predictable, they should be capable of more targeted control. The repeated appearance of the same accident types should therefore be viewed not as evidence that prevention is impossible, but as evidence that the current mix of controls may not yet be addressing the causes at the most effective level.
The 2025 data points towards a need for targeted, practical and design-led intervention. The industry should continue to improve competence, supervision and reporting, but future gains are more likely to come from removing or reducing exposure to recurring hazards than from repeating the same awareness messages.
Manual handling should be treated as the leading operational safety improvement theme, for which the BDA are offering support through bespoke manual handling training to our membership. However, this issue requires more than refresher training. It requires a systematic review of how drilling equipment is specified, transported, unloaded, positioned, handled, connected and maintained. Where tasks consistently require heavy or awkward handling, the industry should consider whether mechanical assistance, altered equipment design, improved logistics or changed work sequencing could reduce the exposure.
Hand and finger injury prevention should also become a specific focus. The body-part data indicates that hand exposure remains a significant issue. This should prompt renewed attention to pinch points, line-of-fire risks, rotating or moving equipment, tooling interfaces and the design of guards, clamps, handles and controls.
Slips, trips and falls should be considered as planning and site design issues as much as behavioural issues. Better access routes, improved housekeeping, designated storage areas, ground preparation, lighting, pedestrian segregation and mobilisation planning are all likely to provide more reliable control than relying only on worker vigilance.
Near miss data also presents an important opportunity. The 2025 dataset recorded 1,739 near misses. This is potentially a valuable leading indicator, but only if the quality of reporting is sufficient. The next step should not be simply to increase near miss numbers, but to improve the usefulness of near miss information.
The 2025 accident statistics show an industry that is improving its reporting maturity and reducing reportable injury outcomes, while still facing persistent operational risks. The increase in member participation to 90% is a significant achievement and gives the BDA a stronger evidence base from which to influence future safety improvement.
However, the data also shows that the sector’s most common accident types remain familiar. Manual handling, slips, trips and falls, contact with machinery, hand and finger injuries, and vehicle incidents continue to feature prominently. HSE construction data supports the wider relevance of these themes, particularly around musculoskeletal harm, construction’s elevated non-fatal injury rate and the continued prominence of slips, trips, falls from height, handling and struck-by-object events.
The principal challenge is now how effectively those known risks are eliminated, engineered out, redesigned or reduced before work begins. The BDA’s forward strategy should therefore focus on converting data into targeted industry action. Manual handling reduction, hand and finger injury prevention, vehicle and road risk management, higher-quality near miss learning, continued mental health support and improved design-stage risk reduction should form the core priorities for 2026.